
 Rated Excellent on Trustpilot


20 Year Gold Price History in US Dollars per Ounce


Live metal prices at your fingertips
Download our app


Price alerts straight to your inbox
Sign-up to receive alerts based on your options below
Signing up to a Prices Alert allows you to receive precious metal price alerts when the precious metal price changes by a set amount across a variety of time periods (see below)
|
1.0% in 1 hour
1.5% in 24 hours
2.0% in 1 week
3.0% in 1 month
5.0% in 3 months
10.0% in 6 months
15.0% in 1 year
|
|
2.0% in 24 hours
3.0% in 1 week
5.0% in 1 month
10.0% in 3 months
15.0% in 6 months
20.0% in 1 year
|
|
1.0% in 1 hour
2.0% in 24 hours
3.0% in 1 week
5.0% in 1 month
10.0% in 3 months
15.0% in 6 months
20.0% in 1 year
|
|
1.0% in 1 hour
2.0% in 24 hours
3.0% in 1 week
5.0% in 1 month
10.0% in 3 months
15.0% in 6 months
20.0% in 1 year
|
Advance Alerts allow you to specify specific thresholds at which you want to receive an alert, this could be a price or a percentage change.
BullionByPost Investment Calculator
Use our investment calculator to discover a range of products and investment options suitable for your budget.
Featured Categories
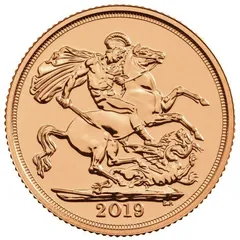
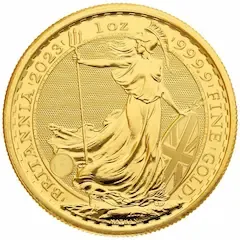
The above chart shows the price of gold for the past twenty years in US Dollars per ounce. In the past two decades gold has seen a meteoric increase in price. Notice the steady climb in the price of gold as financial markets across the US crashed and investors turned to the safe-haven asset of gold. Since 2013 gold has stayed above $1,000 per ounce, staying high above its pre-crash prices.
Using the various buttons at the top of the page, you can tailor the chart to your specific needs; including metal, weight, length of time, and currency.